There's no yet the function paint(as.van.gogh(..),..) , but it's already possibile to get a beautiful paint in Van Gogh style training no less than 150 models (perhaps, after 20/30 hours computing) with the same sampling algorithm and painting resampling results across models where each line corresponds to a common cross-validation holdout (aka parallelplot).
Why doing that? ... that's another story ... anyway, I find the use of red a bit excessive, so we can sell it as a Van Gogh of earlier years. Very important, there're no correlation with the problem, as results don't change.
And what about a Matisse? ...same information can be presented with dotplot ... and results don't delude.
Monday, November 03, 2014
Saturday, October 11, 2014
Comparing Octave based SVMs vs caret SVMs (accuracy + fitting time)
In this post caret R package regression models has been compared, where the solubility data can be obtained from the AppliedPredictiveModeling R package and where
So, Octave based SVMs have similar accuracy performances of caret SVMs (0.59 vs 0.60 RMSE) on this data set (perhaps, a bit better), but they are much more fast in training (9 secs vs 424 secs). In my experience, same considerations holds for memory consumption, but I'm not going to prove it here.
This is a hybrid choice, good for all seasons. It's the aggregation of 2 "pure architectures":
- Models fitting on train set > 15 minutes has been discarded.
- Accuracy measure: RMSE (Root Mean Squared Error)
From this, the top performing models are Support Vector Machines with and without Box–Cox transformations. Linear Regression / Partial Least Squares / Elastic Net with and without Box–Cox transformations are middle performing. Bagged trees / Conditional Inference Tree / CART showed modest results.
SVMs with Box–Cox transformations performs on test set as 0.60797 RMSE while without Box–Cox transformations as 0.61259.
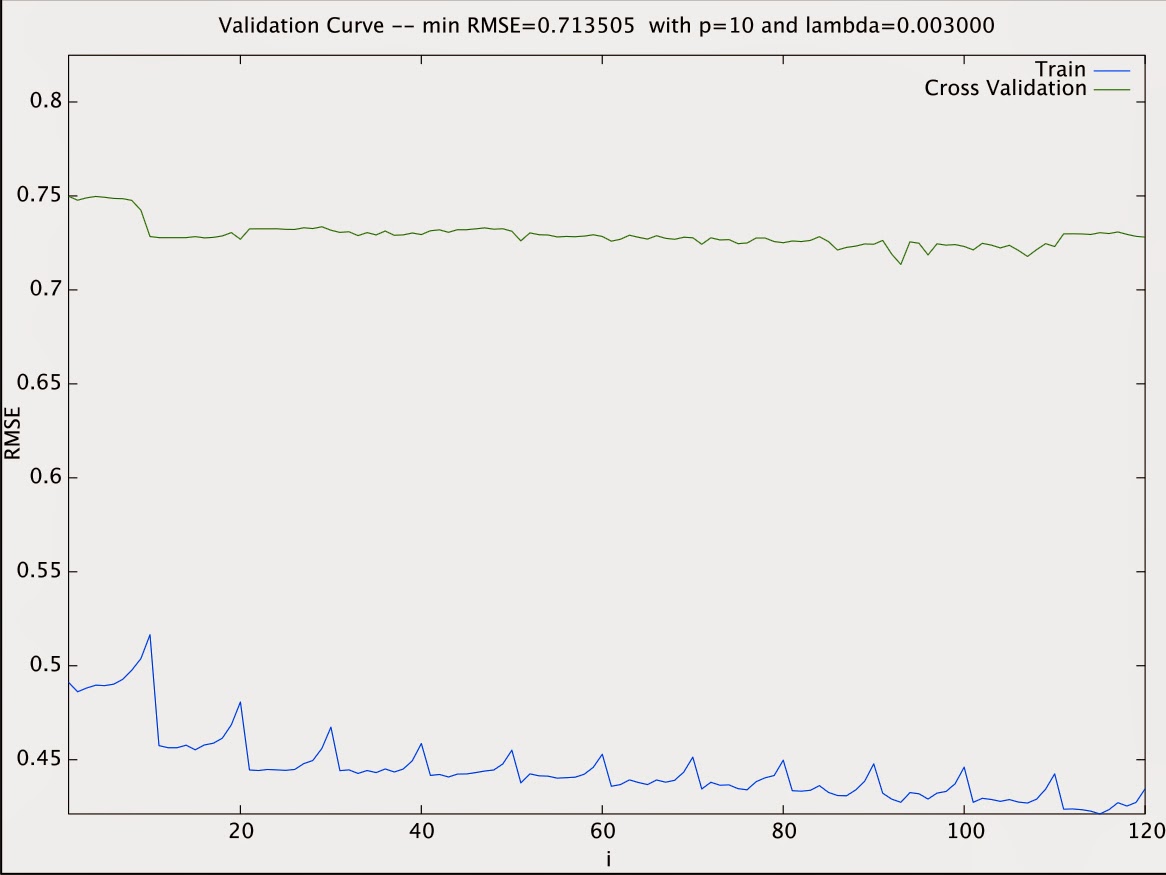
Let's start Octave session with Regularized Polynomial Regression where we got performances pretty similar to caret Elastic Net. We got 0.71 RMSE on test set with a 10 polynomial degree and lambda 0.003. From the validation curve we can see the model is under fitting.
Let's start Octave session with Regularized Polynomial Regression where we got performances pretty similar to caret Elastic Net. We got 0.71 RMSE on test set with a 10 polynomial degree and lambda 0.003. From the validation curve we can see the model is under fitting.
Let's focus on SVMs (fom libsvm package).
epsilon-SVR performs as 0.59466 RMSE on test set with C = 13, gamma = 0.001536 and epsilon = 0.
Time to fit on train set: 9 secs.
epsilon-SVR performs as 0.59466 RMSE on test set with C = 13, gamma = 0.001536 and epsilon = 0.
Time to fit on train set: 9 secs.
nu-SVR performs as 0.594129 RMSE on test set with C = 13, gamma = 0.001466 and nu = 0.85
Time to fit on train set: 8 secs.
Let's go back to our on-line learning applications. In that shipping service website where user comes, specifies origin and destination, you offer to ship their package for some asking price, and users sometimes choose to use your shipping service (y = 1) , sometimes not (y = 0). Features x captures properties of user, of origin/destination and asking price. We want to learn p(y = 1 | x) to optimize price.
Clearly, based on above example, Octave seems a much more performant and scalable choice than R. For instance, our application architecture can be made of
- presentation tier: bootstap js + JSP
- application tier: Octave (Machine Learning) + Java (backoffice, monitoring tools, etc.)
- data tier: MongoDB or MySql
This is a hybrid choice, good for all seasons. It's the aggregation of 2 "pure architectures":
- bootstap + Octave + MongoDB
- JSP + Java + Octave + MySql
For both of them, the question is: is there any interface (open source?) JavaScript 2 Octave / Java 2 Octave / MySql 2 Octave / MongoDB 2 Octave? Are they stable enough for production? What about the community behind them?
Sunday, September 28, 2014
Comparing R caret models in action … and in practice: does model accuracy always matter more than scalability? and how much this is about models instead of implementations?
The post with code and plots is published on RPubs.
Here I report just parallel-coordinate plot for the resampling results across the models. Each line corresponds to a common cross-validation holdout.
Here I report just parallel-coordinate plot for the resampling results across the models. Each line corresponds to a common cross-validation holdout.
Is this a zero-sum game? As for bias and variance, it seems there’s a clear trade-off between accuracy and scalability. On the other hand, continuing the metaphor, as for machine learning problems I need to check there’s no additional noises in addition to bias, variance and irreducible errors, so here it's necessary to check that such a loss of scalability for top performer models is intrinsically bound to the problem and not to the implementation.
Is it possible to improve RMSE performances of linear regressors (that is middle performing in this contest) with an octave based model? Similarly, is it possible to build a nu-SVR based model that improves caret SVM RMSE performance fitting on the training set in less than a minute?
… stay tuned …
Saturday, April 05, 2014
Subscribe to:
Comments (Atom)


