Sunday, April 19, 2020
Thursday, November 05, 2015
PippoProxy reached ~3000 downloads

Ten years ago PippoProxy was born and, although from that moment ~6 Java versions have been released, I'm very proud of this well crafted piece of code. The SourceForge release (at the time GitHub wasn't yet born) was called CheSpettacolo in honor to Valentino Rossi the Italian motorcycle racer and many times MotoGP world champion who, at that time, was winning one of first MotoGP. I was senior software architect at the N.1 Italian web portal and I was working on search engines and text mining projects....
Wednesday, August 19, 2015
Collateral effects of a bad resampling procedure
Resampling technique
To reduce the influence of randomness introduced by data split, 8-fold cross-validation has been repeated 3 times, i.e. 3-times 4-fold cross validation.
Data transformations, models and meta-models
Measured cross-validation score and Kaggle Public LB score in a wide range of configurations:

t-test
On the choice of the t-test (paired difference test) for this problem, please see [Dietterich, 1998]. Assuming the null hypothesis as the means of cross-validation score and Kaggle Public LB score are equal., it results that difference in means with 95 percent confidence lies in the interval [-0.05392342, -0.02951592]. So,there is a bias.
Why such a bias
AS a tube_id has 3.4 +/- 2.9 different prices, if in a cross-validation training holdout set I have instances of tube_id occurring also in the related cross-validation test holdout set (maybe related to different quantities or quote dates) I am training my learner with a train set probably more correlated with the related test set than the whole train set is correlated with the whole test set (both public and private). And also, probably the related effect is more evident for low rmsle scores than for high rmlse scores.
To reduce the influence of randomness introduced by data split, 8-fold cross-validation has been repeated 3 times, i.e. 3-times 4-fold cross validation.
Data transformations, models and meta-models
Measured cross-validation score and Kaggle Public LB score in a wide range of configurations:
- scaling numerical numerical predictors or without scaling;
- removing high-correlated predictors or without removing them;
- clustering (train/test) data (2/4/8/14 clusters configurations; 2 different predictors for clustering) or without clustering data;
- stacking, i.e. training (k+1)-level learners to combine predictions of k-level learners or meta-learners, or without stacking (in case of stacking, 2 and 3 architectural layers used);
- using a wide range of algorithms (knn, cubist, xgbTree, enet, pls, gbm).
The idea is that if I am making some mistake in the process whose effect is creating a difference between cross-validation score and Kaggle Public LB score, then such difference should have a proper variance. In this case it would not be correct talking of bias.
Observations

On the choice of the t-test (paired difference test) for this problem, please see [Dietterich, 1998]. Assuming the null hypothesis as the means of cross-validation score and Kaggle Public LB score are equal., it results that difference in means with 95 percent confidence lies in the interval [-0.05392342, -0.02951592]. So,there is a bias.
Why such a bias
AS a tube_id has 3.4 +/- 2.9 different prices, if in a cross-validation training holdout set I have instances of tube_id occurring also in the related cross-validation test holdout set (maybe related to different quantities or quote dates) I am training my learner with a train set probably more correlated with the related test set than the whole train set is correlated with the whole test set (both public and private). And also, probably the related effect is more evident for low rmsle scores than for high rmlse scores.
Friday, July 24, 2015
Technical features correlation vs Cost - Kaggle's Caterpillar Tube Pricing
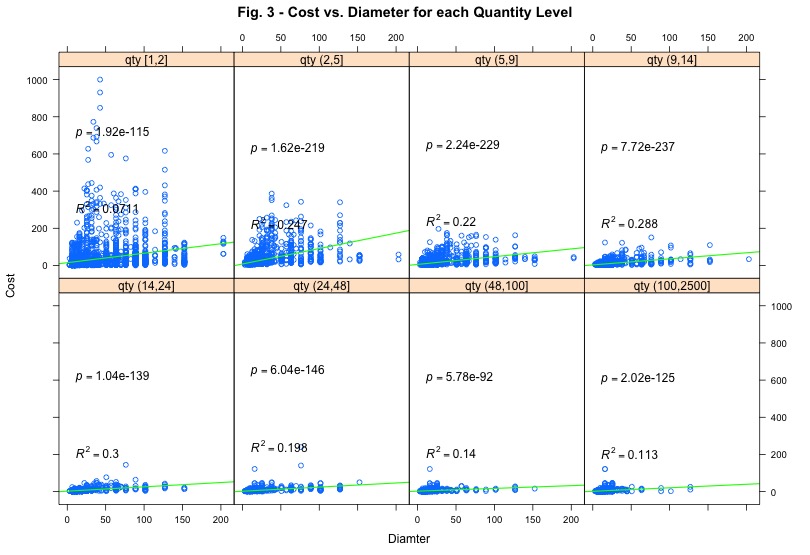
Wondering if for higher levels of quantity tube technical features are less correlated to the selling price. This could be pretty expectable as the more the quantity the more the discount Caterpillar buyers are likely to ask.
Thursday, June 25, 2015
Monday, April 27, 2015
Very proud of my 8th place / 504 teams - Kaggle's American Epilepsy Society Seizure Prediction Challenge
5 months have passed since the Kaggle's American Epilepsy Society Seizure Prediction Challenge finished and Isaac (my Kaggle's alias) placed 8th.
Monday, November 03, 2014
How to paint a Van Gogh with R Caret ... and suicide immediately after!!
There's no yet the function paint(as.van.gogh(..),..) , but it's already possibile to get a beautiful paint in Van Gogh style training no less than 150 models (perhaps, after 20/30 hours computing) with the same sampling algorithm and painting resampling results across models where each line corresponds to a common cross-validation holdout (aka parallelplot).

Why doing that? ... that's another story ... anyway, I find the use of red a bit excessive, so we can sell it as a Van Gogh of earlier years. Very important, there're no correlation with the problem, as results don't change.
And what about a Matisse? ...same information can be presented with dotplot ... and results don't delude.
Subscribe to:
Posts (Atom)